Turn Space Data Into Smarter Decisions
Get a clear view of how your office is used so you can reduce waste and plan better.
Request a Density demo
Trusted by industry leaders


Make every square foot count
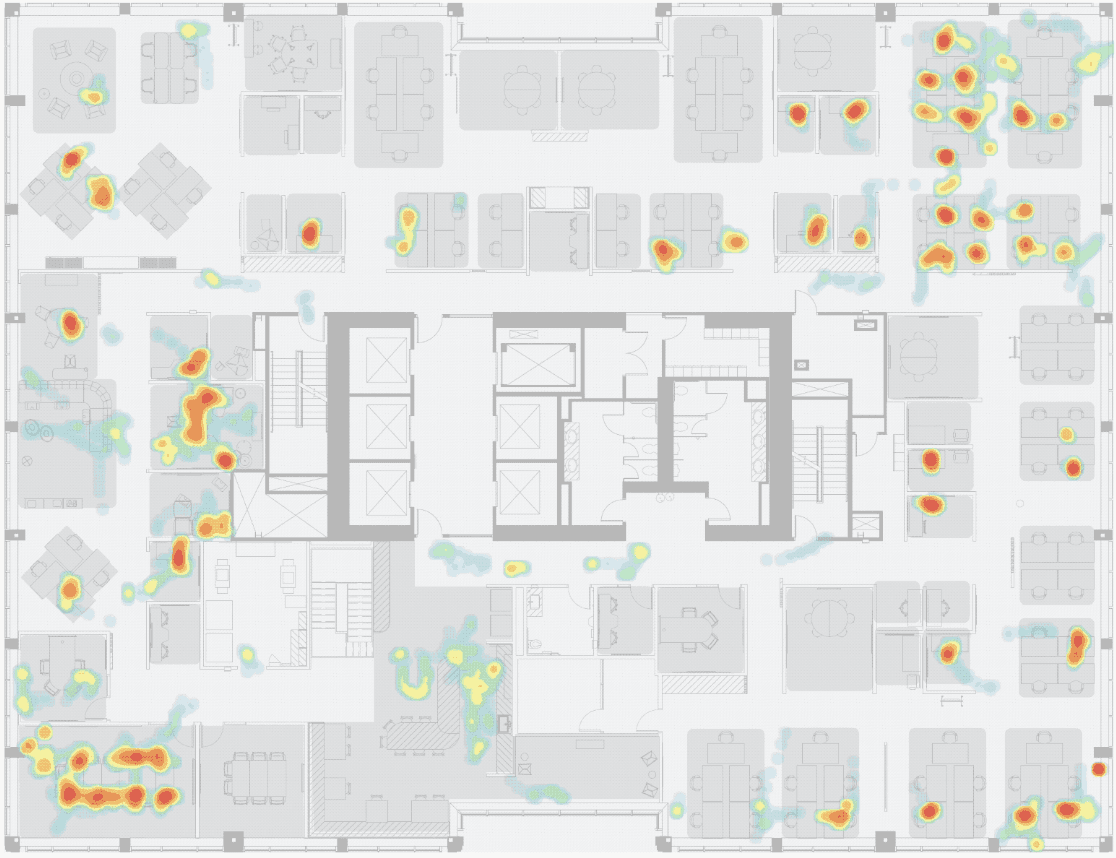
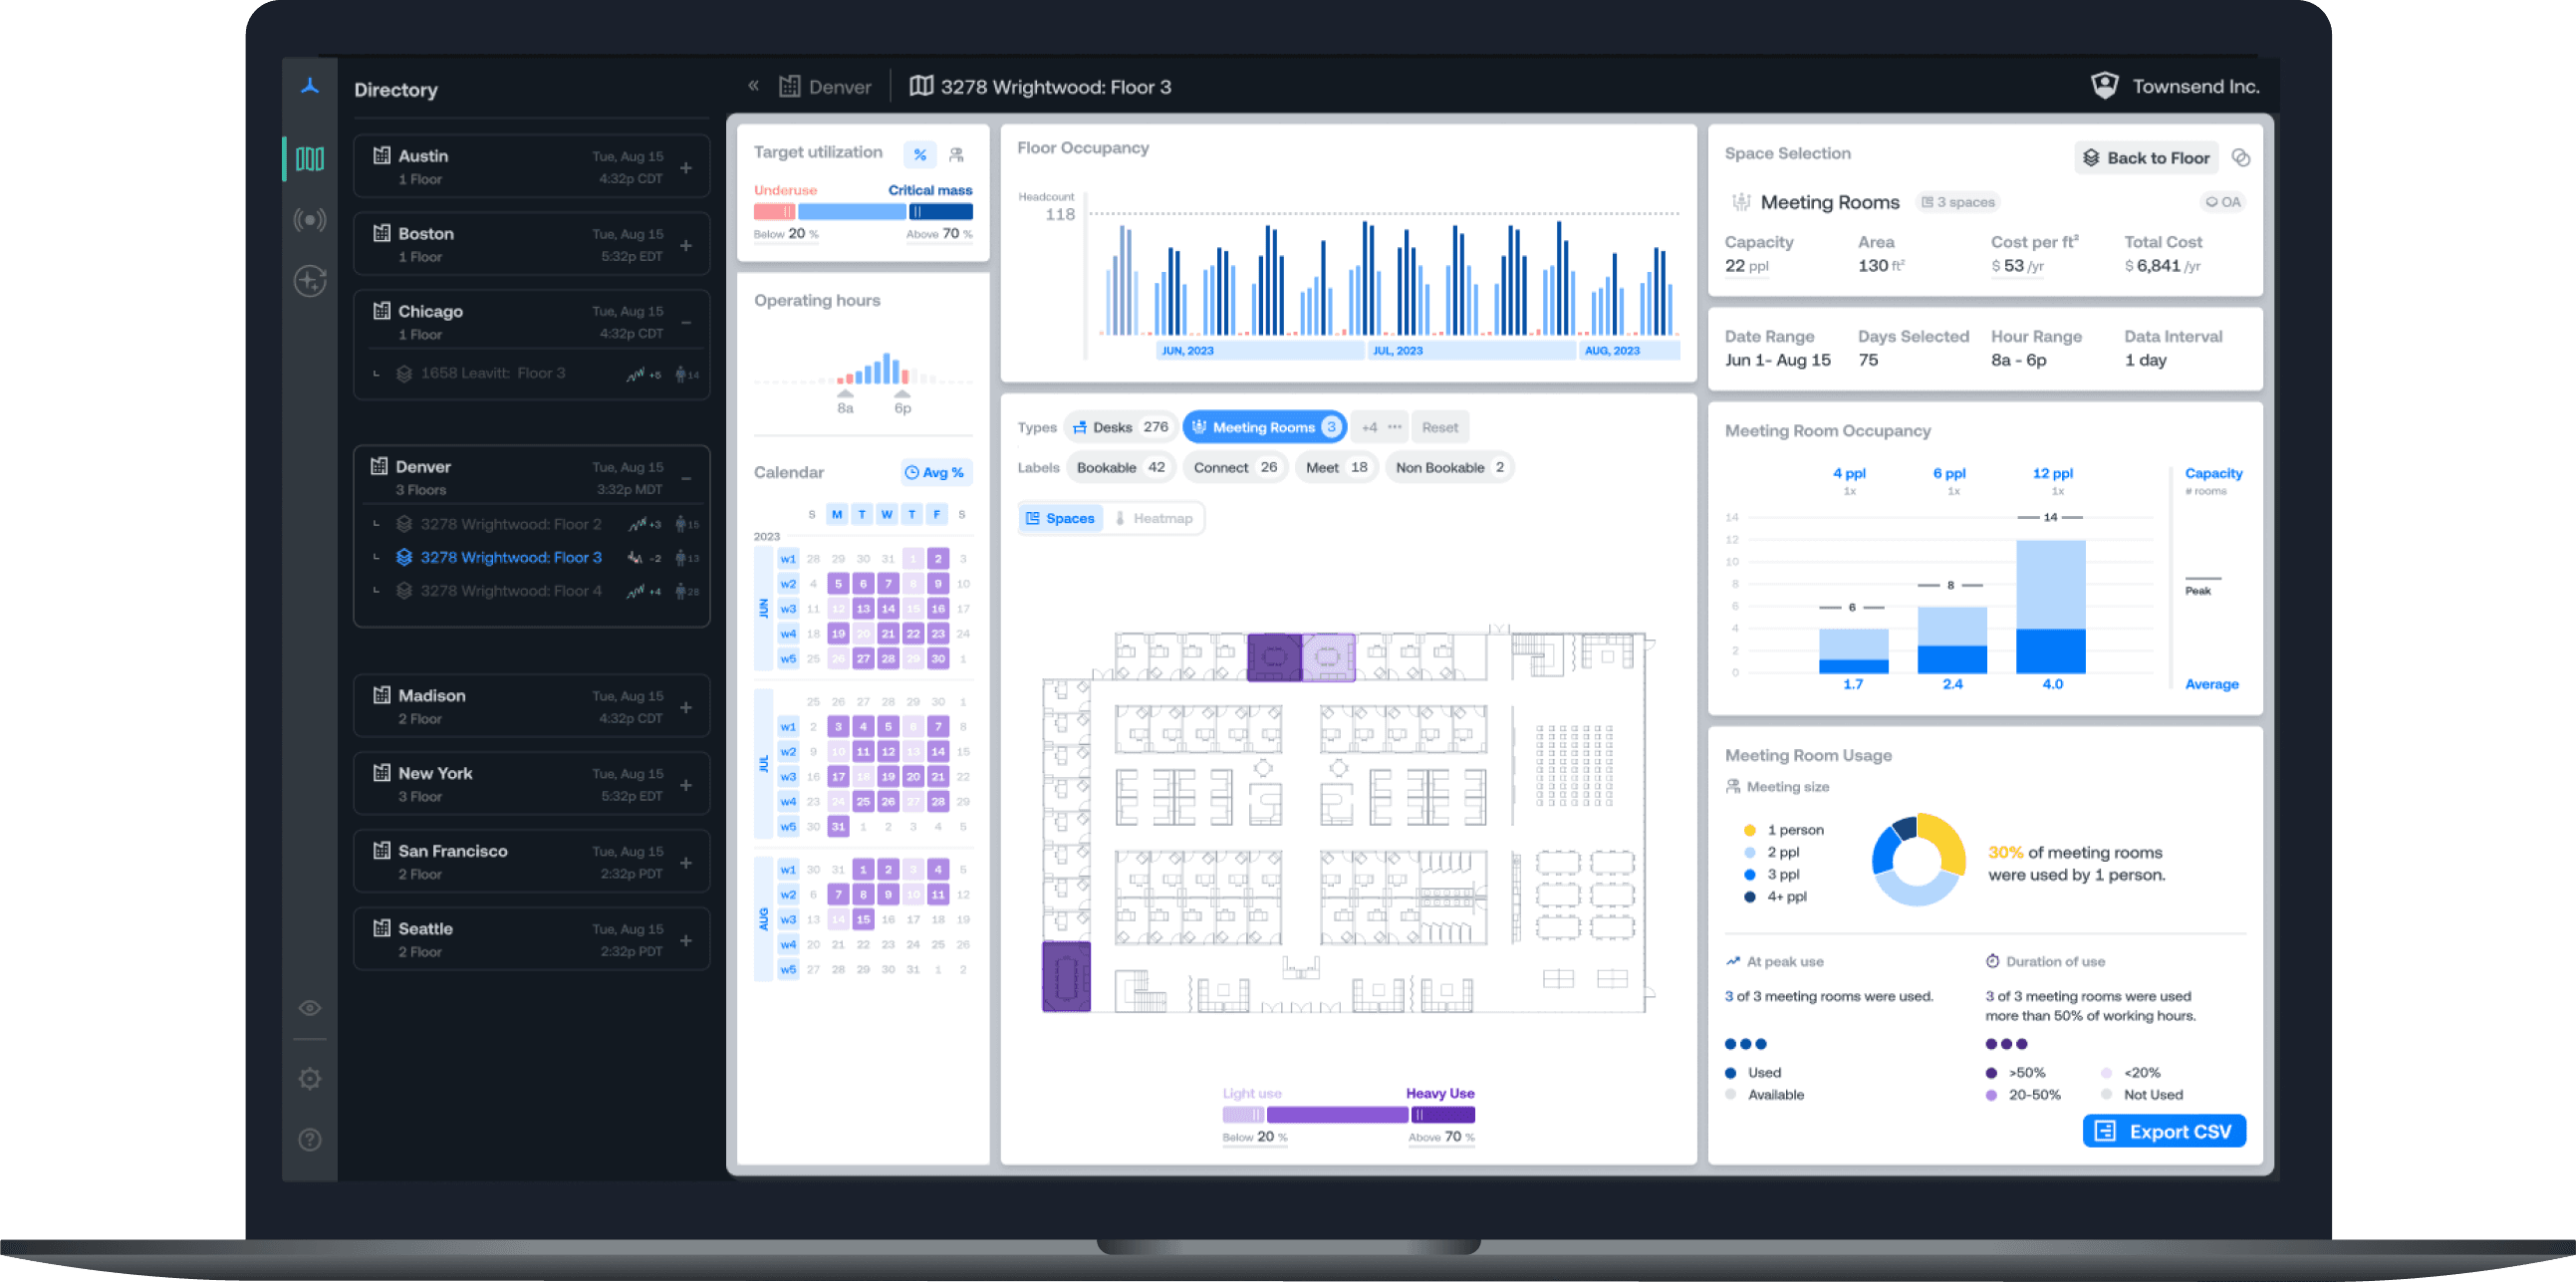
Visualize utilization by floor, zone, or building
See exactly how every area of your portfolio is being used. Drill down from building-level overviews to individual floors and zones.
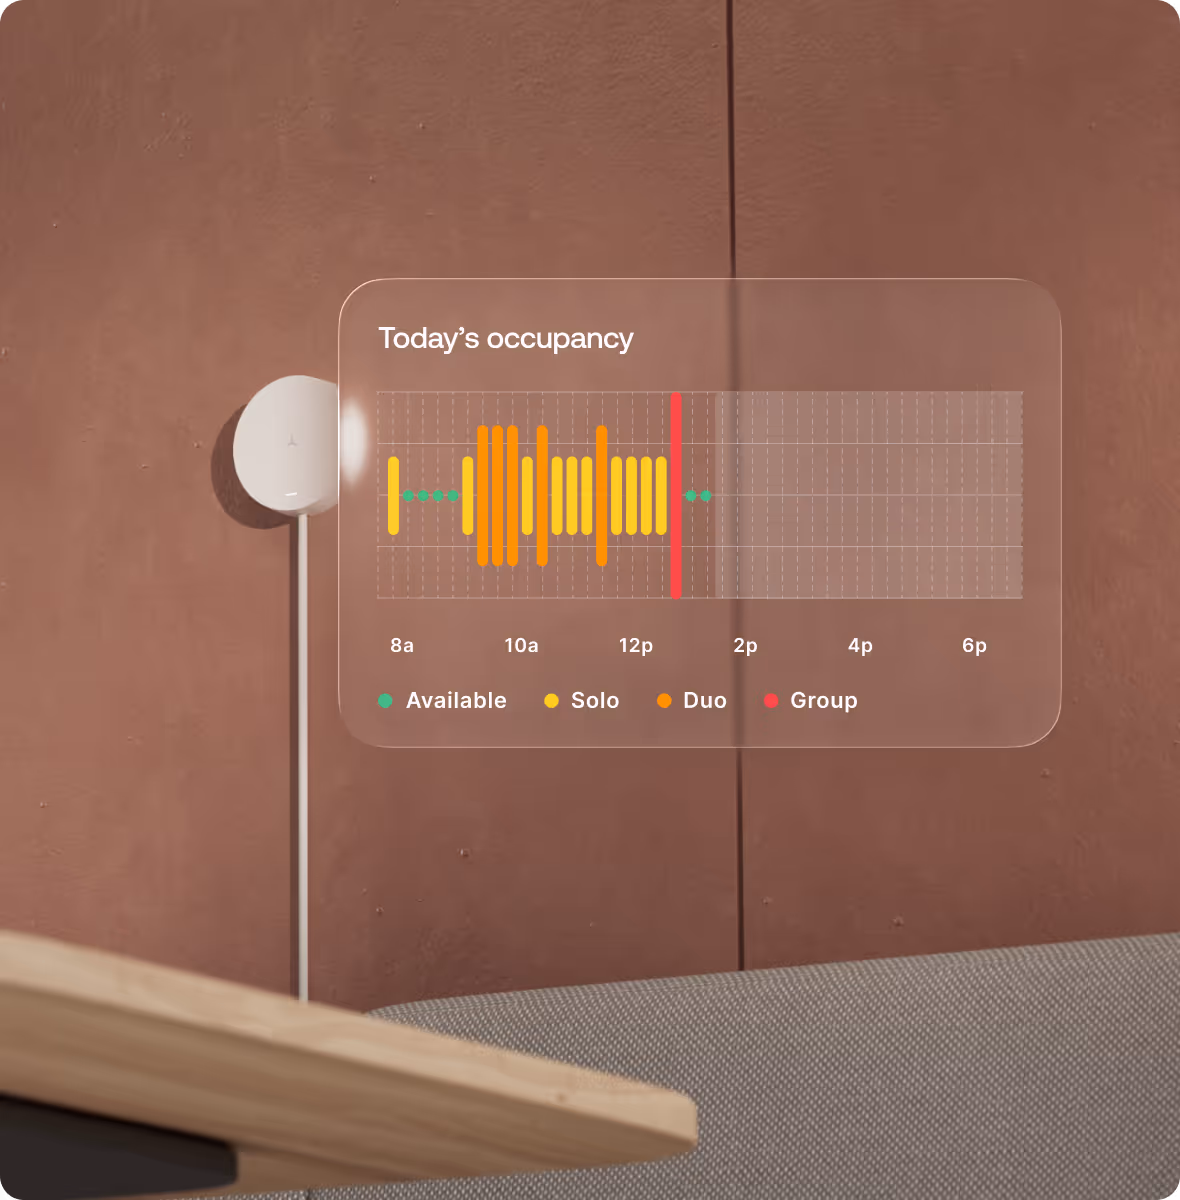
Spot trends across time and locations
Identify patterns in how space usage changes by day, week, or season. Compare utilization across your entire portfolio to find opportunities.
Right-size space to match demand
Use real data to determine how much space you actually need. Avoid over-leasing while ensuring you have room for growth.
Back real estate decisions with data
Replace gut feelings with concrete evidence. Build business cases for expansions, consolidations, and redesigns that stakeholders trust.
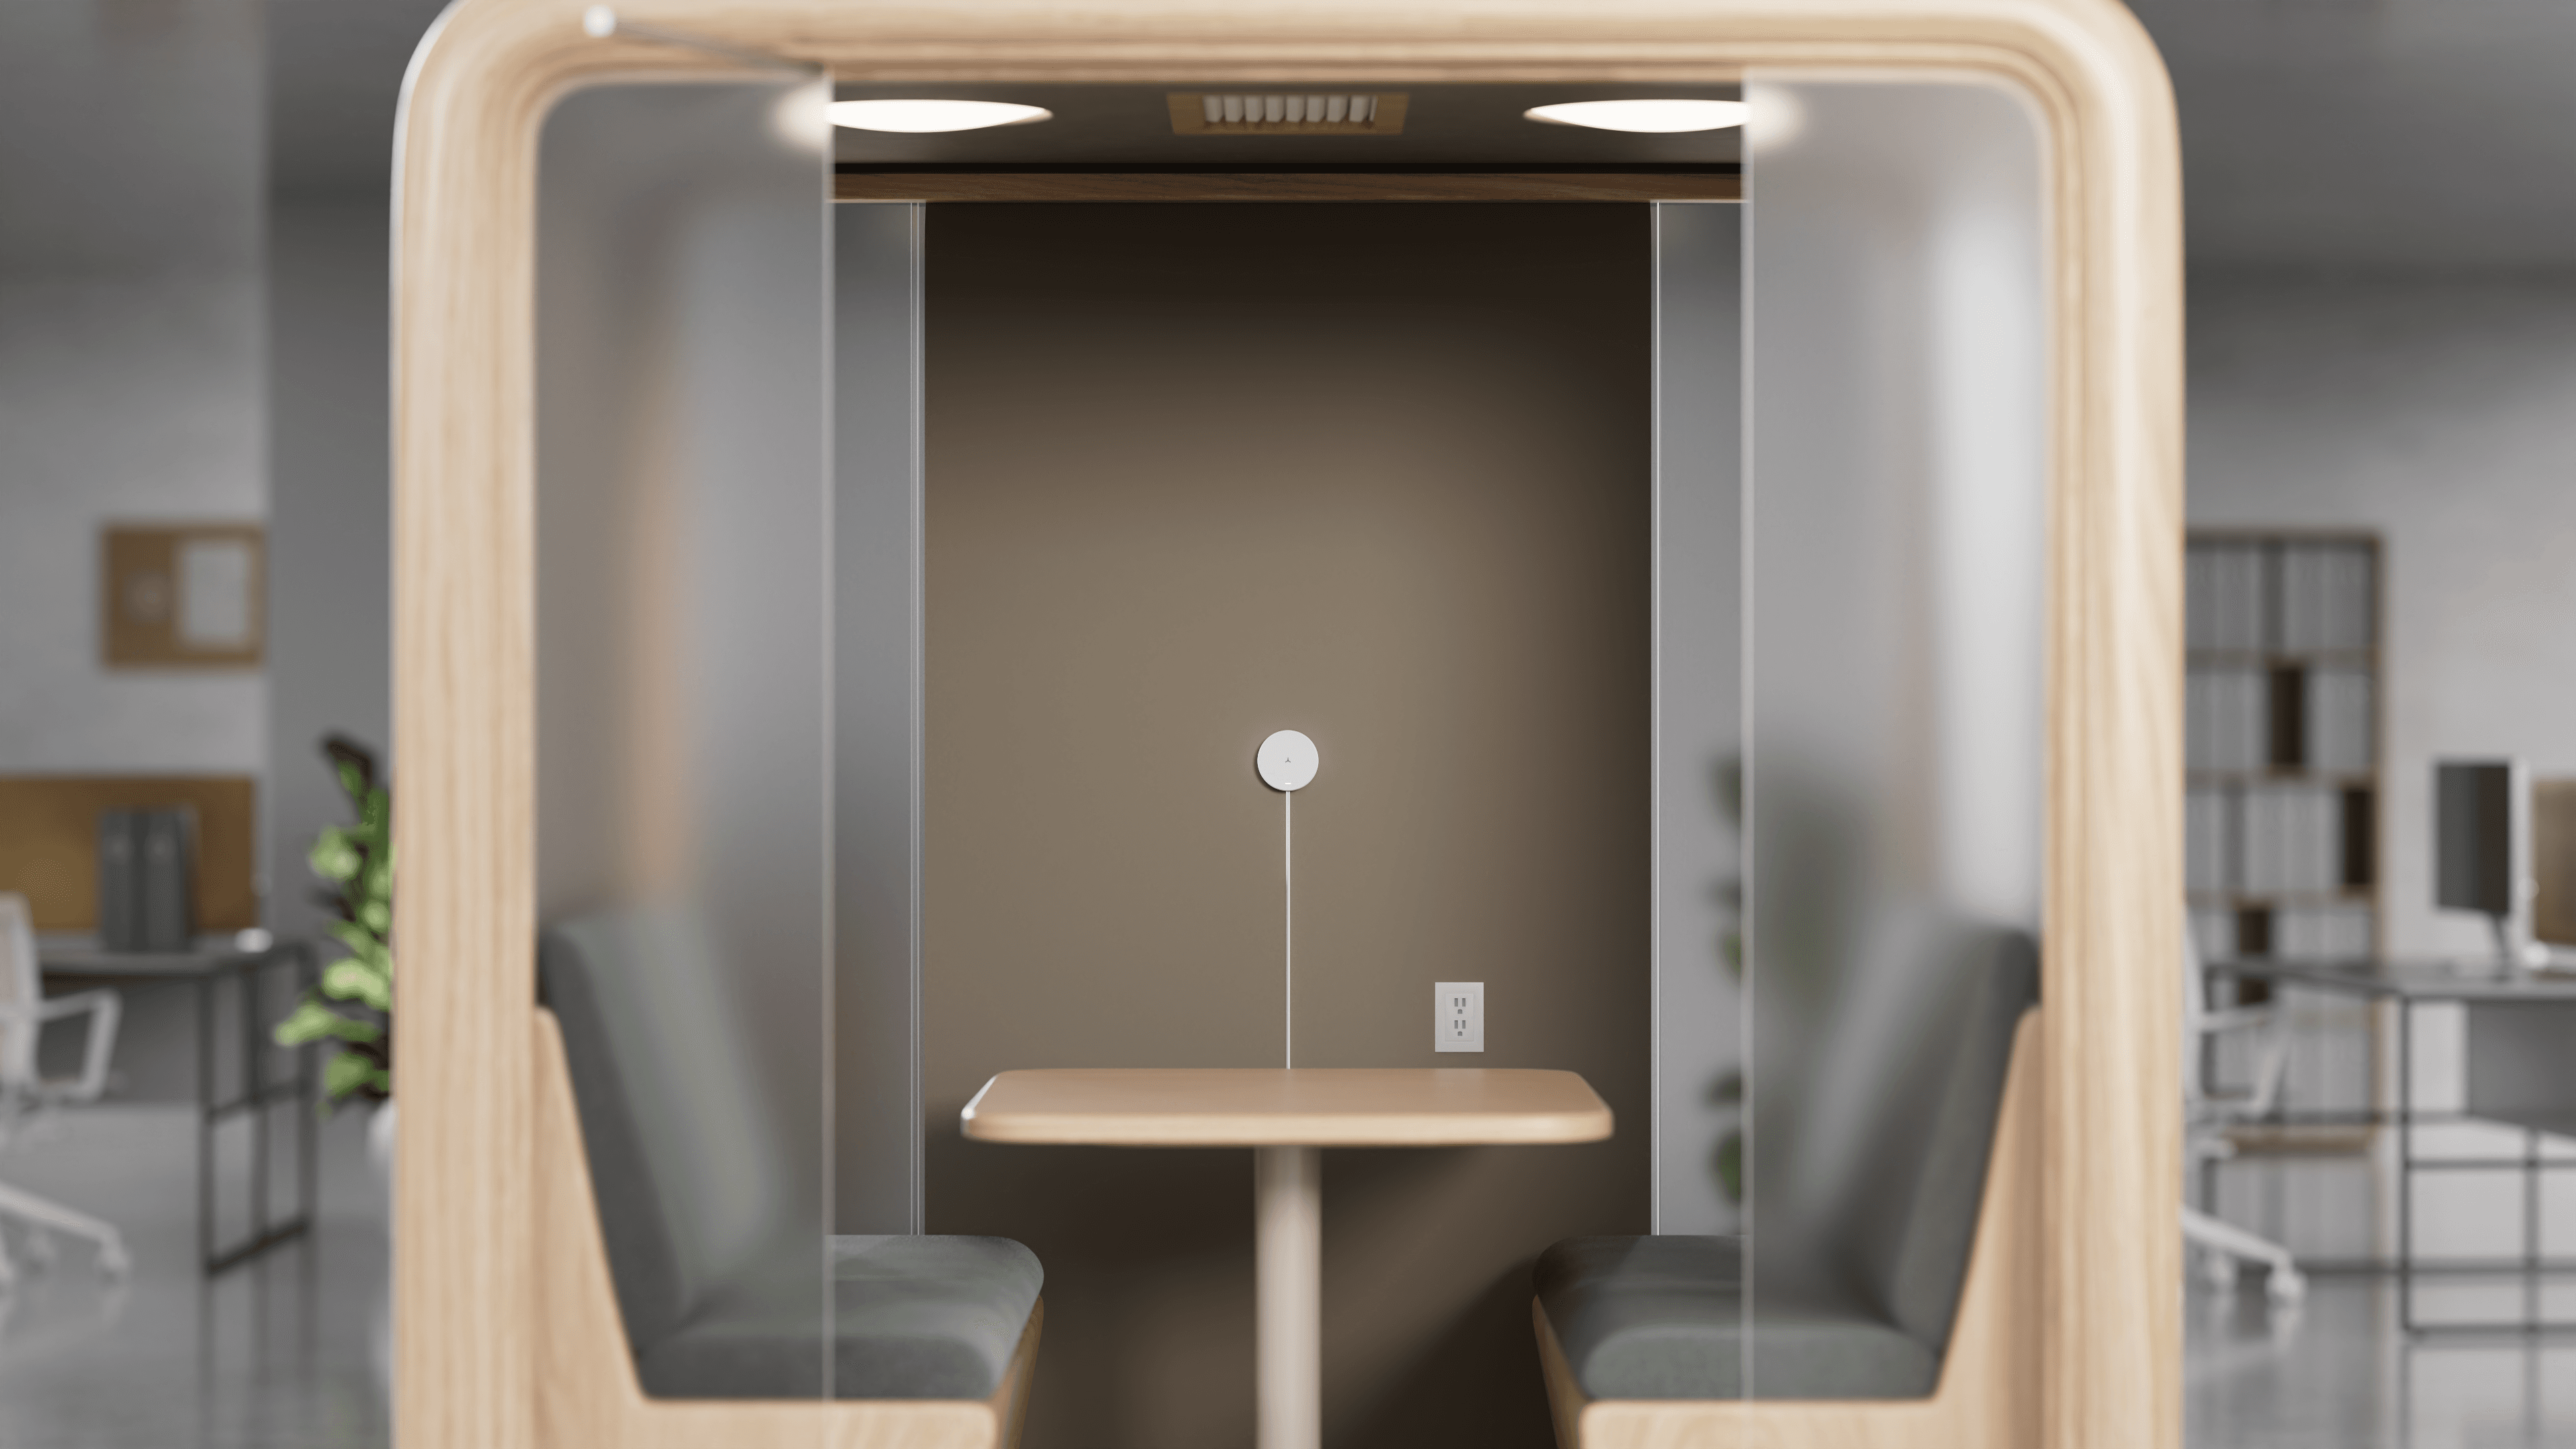
100% anonymous
Density uses radar technology to count people without compromising privacy. Our sensors cannot capture video, audio, or other personally identifiable data.

- No cameras. No microphones. No PII.
- Software built to meet enterprise-grade security requirements
ROI you can measure
A solution that pays for itself. One client recently calculated a 16x return on their Density investment.
Over $3 million in avoided lease costs
With Density data revealing only 38% average utilization, the client avoided signing an unnecessary lease and saved millions.
$800K annual savings by releasing over 1,000 sq ft of unused space
Incremental consolidation improved peak utilization by 36% and maintained employee experience — freeing premium real estate while leaving headroom for growth.